Analysing the VR market based on 2017 Steam data

UPDATE (10:16 AM, Jan 15, 2018): In response to the confusion caused by not all 928 titles fitting on figure 6 and 7’s thumbnail axes, I’ve added high-res versions as links.
This week’s Ganbatte dev blog post covers an important topic for arguably any game developer, and especially for a developer like Mimicry active in the young industry of virtual reality: market research. When asking questions like: “when’s a good time to release?”, “what can we expect in terms of sales?” or “what’s a good price? ” knowing your market is essential in helping to find the answers. Of course, it’s primarily up to the game itself (not to forget about marketing, communication, timing and.. a bit of luck) but a good understanding of the market sets you up to the right expectations and can definitely help in decision making. You can do this reading the latest industry news, attending conferences, but one of the ways I like to inform myself is by investigating the state of the market (of virtual reality games and applications) in a data-driven way. In this week’s post, I will be sharing my findings, by analyzing data collected from Steam and Steam Spy.
If you’re new here; I’m Thomas Papa, and I’m running a small VR game studio called Mimicry. You’re reading the development blog of Ganbatte, our upcoming VR game. At Mimicry, I wear a lot of different hats, from game design to biz dev, from creative direction to 3d modeling. I care a lot about market insights because with running a studio comes the obvious responsibility of making informed decisions. Besides that, I’m passionate about VR and have a deep personal interest in the way technology paves the road for new interactive experiences and forms of interaction. However, the stories that are told by the media paint very different pictures about VR and the state of the VR market. I find that the news that I read is either too optimistic or too pessimistic. It’s very often both simplified as well as polarised. Being the skeptical optimist that I am, I want to understand the state of the VR market through my own research, hence this analysis.
Whether the decision is strategic, technical or even creative, strong market insight is key. In this case, I did the research specifically for our multiplayer VR game Ganbatte, the game that this dev blog is all about. Ganbatte is a social VR arcade game about cats eating sushi in space. The game focuses on competitive sushi eating and taunting your opponents. Ganbatte pairs a strong core mechanic with a high replay value and social elements. Looking at the market data of Steam, the store in which Ganbatte will soon be available, what can we expect?
My approach

Detailed market data is hard to find, and it’s usually not disclosed by marketplace owners. Even when it is disclosed, it’s usually only partial, for promotional reasons, not giving the complete perspective. In my opinion, while obviously not beating official figures, SteamSpy is the best source for market data, especially for a bootstrapped indie like Mimicry. To quote Sergey when writing about the accuracy of the data “…Steam Spy has to gather millions points of data daily to predict games sales and audience. And that’s why Steam Spy is often wrong. Not by much, but still wrong.” If you’re not acquainted with it, you can read more about the details and limitations of SteamSpy’s data gathering technology over on SteamSpy’s about page. Which will give you an idea of how reliable the data is. And, subsequently, how to read my analysis. In short: it’s limited and indicative. I might have made some mistakes. Pairing SteamSpy’s limitations with my own (human) margin for error and the way I’ve filtered the data, I would consider the results of this analysis moderately reliable. But I certainly wouldn’t use them as your sole source for market insights.
I wanted to find out how the market for VR games and applications on Steam developed over the course of 2017, by looking at each titles’ release date, amount of owners and price. I limited my data set on the Steam store using the type criteria “Games” and “Software” and I narrowed down the list to “VR Supported”.
My reasoning behind this is that the other types are not relevant to me specifically, as they fall into a significantly different market segment (e.g. demos are not products actually sold). And for VR support, I wanted my data to include titles that would support both screens as well as VR, since there are a couple of titles that include both, and they are, to various degrees, part of the same market as Ganbatte is. It is, however, important to note that games which support both VR, as well as regular monitors (or flatties some people call them), will have significantly higher sales numbers because they are also bought by non-VR users. Ideally, it would be best if we could know how many of those owners have a VR headsets versus those who don’t, but that data is unfortunately not publicly available.
Findings
I took the titles from the Steam store and compared them to SteamSpy’s data set for 2017. Then, I started filtering and doing a statistical analysis of the data to see what I could learn from it. This is what I found.
Number of VR releases
Total amount of VR titles released on Steam in 2017: 1271
Total amount of owned VR titles released on Steam in 2017: 7.806.051
While this amount of owners isn’t the same as “amount of copies sold” (e.g. free weekends count as well) it still gives a good indication of its sales. Throughout this analysis, I will sometimes talk about selling/sold but this should be interpreted as “amount of owners”. In my analysis, I focus on titles priced at 1 USD or higher, and not on free titles. This is because the game we’re developing, Ganbatte, is a premium (paid) title, and thus it’s the statistics of premium titles I’m specifically interested in. From here on, I will refer to these titles as premium (but I’ll continue to clarify).
There are 306 titles that have 0 owners. When removing these titles that don’t have any owners (according to SteamSpy this is because “they’re either recent or not selling well…we don’t have enough data about owners to show it yet.”) and focusing only on titles that were 1 USD+ we get the following number:
Total amount of VR titles released on Steam in 2017 (1$+) with owner data: 677
Total amount of owned premium VR titles released on Steam in 2017 (1$+): 3.252.661
Figure 1
Looking at the number of VR supported releases on a monthly basis, we get the following results (figure 1). November takes the lead as the busiest month for VR releases last year, while January was the quietest. The number or releases show an upward trend towards the end of the year.
Figure 2
If we take a look at the number of premium VR supported releases on a monthly basis (titles that were priced $1 or higher), we get a similar perspective, with obviously fewer releases and fewer variations (figure 2). The trendline shows an almost similar growth in the number of releases to the previous, non-price-filtered graph.
Figure 3
When removing the titles that don’t have enough data about owners to show it, the graph looks almost completely flat, with a practically completely stable trend line (figure 3). One could argue that the number of VR supported titles released on Steam with at least some copies sold (better said: owners) is fairly steady, at around 50 titles per month. Steamspy’s algorithms start showing owners at around 700, with a high error margin due to having not enough data.
Pricing
Titles priced at 1 USD or more: 983
Free titles or less than 1 USD: 288
Figure 4
Average price of VR titles released on Steam in 2017 costing 1 USD or more: $9.71
Median price of VR titles released on Steam in 2017 costing 1 USD or more: $6.99
This means that 50% of all VR titles (1 USD+) were sold at a price above $7.
Figure 5
When plotting the average price throughout 2017, we find that the average price of a paid, 1 USD+, VR title on Steam has doubled, from $7.08 to $14.13.
Expected ‘Sales’
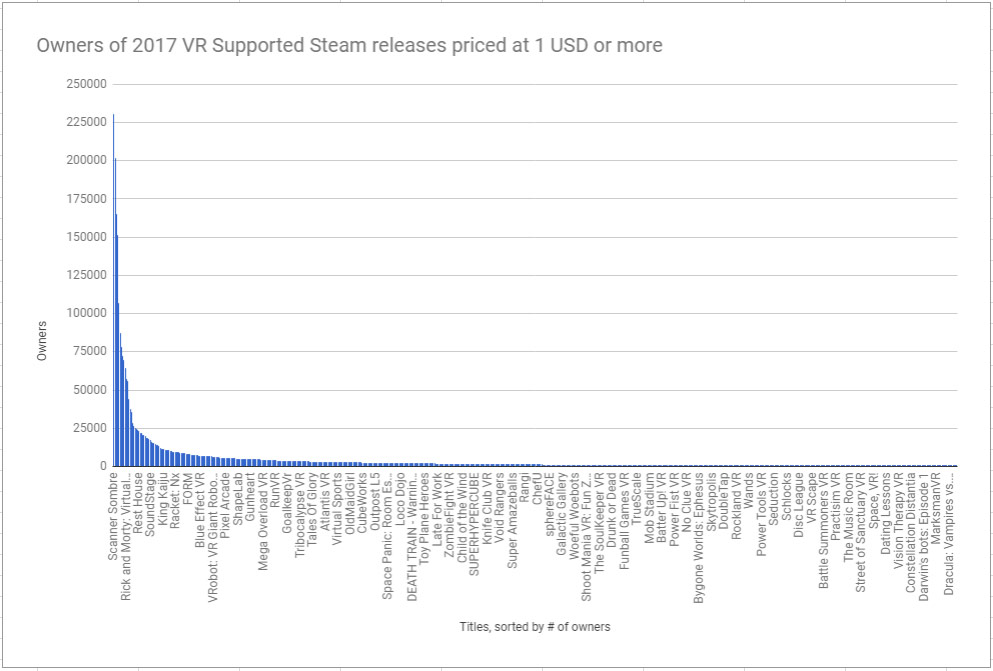
What to expect in terms of owners, then? Again, I’m limiting my analysis to paid titles that are priced at 1 USD or more. Although to be expected, the first interesting find is that only a small amount of games have a large number of owners. The majority of sales in the VR market can be attributed to only a small number of games. To put it differently, even though the market has grown, most games don’t sell very well, at all. In statistics, this is also known as a power law, which is a relationship between two quantities such that one is proportional to a fixed power of the other, a distribution that can be observed across man-made and natural phenomena. In the case of this analysis, no matter how large the market of VR games and applications is, the number of titles with a large number of owners will (most likely) always have the same proportion size to the number of titles with a small number owners. An example of this distribution is the Pareto principle (also known as the 80/20 rule), where 20% of the effort results in 80% of the results. Or 20% of the games on the market are responsible for 80% of the total market revenue. In other words: Few dominate the market. In the case of VR supported titles on Steam the Pareto principle holds up pretty well, with 20% of the titles having around 83.5% of the total amount of owners.
Another interesting find is that the amount of owners per game varies greatly, showing a huge gap between the number of games that sell relatively well and those that don’t. The graph shows a steep transition down into the long-tail.
Figure 6 (sorted by # of owners) ⚠ thumbnail horizontal axis doesn’t display all 983 titles! CLICK FOR HIGH RES VERSION
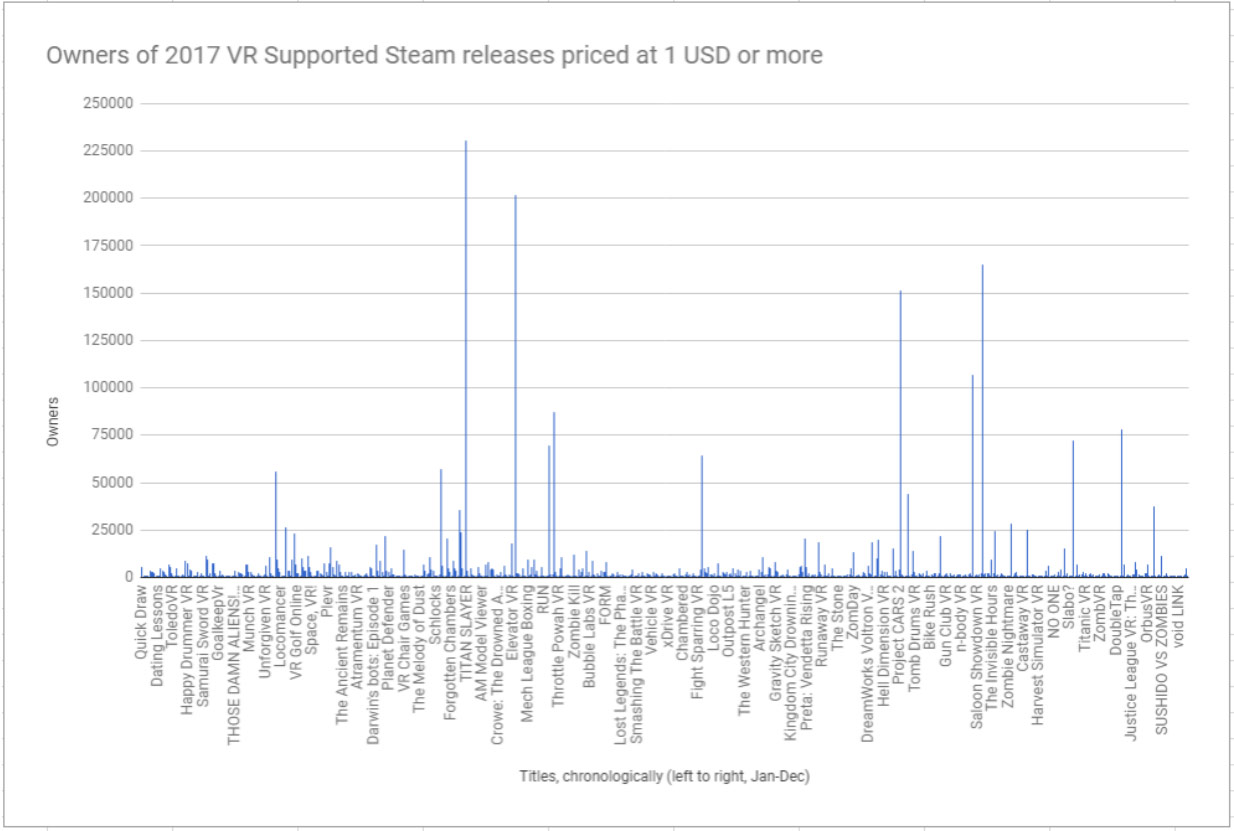
Figure 7 (chronologically) – ⚠ thumbnail horizontal axis doesn’t display all 983 titles! CLICK FOR HIGH RES VERSION
Apologies for the above graphs not being interactive, it’s too much data to display properly. Please drop me an e-mail at thomas[at]mimicrygames.com if you’re interested in the full graph. *added highres versions of figure 6 and 7 as links.
Only 12 titles (out of 983) managed to reach more than 50.000 owners (figure 6 and 7). That’s 1.2% of all titles. Out of these 12 titles, almost half (5) are also playable in non-VR mode, namely: Scanner Sombre, Everspace, Star Trek Bridge Crew, Project Cars 2 and Space Pirates And Zombies 2. This means that out of all premium (1USD+) VR supported titles released in 2017 (983), only 7 VR-only titles have managed to reach more than 50.000 owners.
Figure 8
only 10.5% of paid VR games released in 2017 have more than 5000 owners
When creating buckets of the number of owners (aka grouping data with pivot tables) we get the following distribution (Figure 8). This makes it safe to assume that the probability of a paid VR game selling more than 5.000 copies is 10.5%. This is quite the realization: only 10.5% of paid VR games released in 2017 have more than 5000 owners. If this trend continues into the future there is a 1 in 10 chance of making it into the 5000+ group. Actually, if you’re an indie dev without a track record and few marketing resources, your chances are less than 1 in 10. To answer the first question of this paragraph (expected sales), if we look at statistics alone, then it’s most probable for Ganbatte to sell less than 5000 copies. But if it’s up to us – and you guys, our community – we’re here to prove otherwise!
Figure 9
If we zoom in on the sub 5000 owners segment (89.5% of the market) then we find the following distribution (Figure 9). Please note though, that the lower the amount of owners data, the less accurate the data is. The majority of games, almost two third, fall into the 0-1000 group, at 67.3%.
Conclusion
The VR market is a young one, a relatively small one, and a tough one to survive in. Of course, Steam is not the only distribution platform on the market. Channels like the Oculus Store, the PlayStation Store, Viveport and others allow us to reach even more customers. However, going by these numbers alone, it’s going to be hard for most VR titles to come close to breaking even. This might explain the increase in average price. There’s a market, but despite its growth, it’s still small. At the current market size, in order for developers to make enough profit to finance their next VR game, the price has to go up. Although another perspective might be: the quality of the games must go up (and sales will follow).
If it’s one thing that these statistics tell me, it’s that the odds are not responsible for the outcome. The high ranking titles all deserve to be there in the top 20. They made it there through their art and craft. Through the research, the passion, the groundbreaking work that the developers behind these titles have put in. It’s not the probability that matters, it’s the experiences and emotions that we’re enabling through our games that matter. It’s the magic that we’re making.
Games matter. But great games matter more. Games that elevate, entertain, engage and touch people. And that’s exactly what we’re building. With Ganbatte we’re creating a place in VR for people to come together, to compete and to communicate. And I hope to see all of you there.
-Thomas
PS.-How does this data make you feel? Was this analysis useful to you? Did it leave you encouraged? Discouraged? I’d love to know! Leave your response down in the comments.


3 Replies to “Analysing the VR market based on 2017 Steam data”
Nice article! Thanks for sharing it. It matches my experience selling 4 VR titles on Steam, which I’m still disappointed about. (I have an outstanding idea for my 5th title that’s sure to be hugely popular, but no motivation to begin building it after the sour experience thus far.)
Some issues you will encounter selling are:
– Most people have put away their VR headsets, so the market of 1M+ possible consumers is actually much smaller. (I’d guess ~100k but with a small bump from recent xmas sales, but most of them are too busy playing things like FO4 to bother looking for something new. So, realistically you have ~10k possible customers if you start selling right this minute, and if you don’t capture half of those visitors you’ll never surpass 5k sales unless PC Gamer puts you on their cover.)
– People tend to only purchase the “top 10 titles”. You’ll see lots of posts about “the best VR games” and everyone buying just those, since there’s only so much time in the day and people want the best bang for their buck. If you’re not in that top 10, you’ll never see a profit. 🙁
– Steam’s algorithms actively hurt the sale of VR titles, because they get lumped-in with PC games. It would take an article to explain in detail, but they are ironically trying to build and simultaneously kill the VR market at the same time. (Their flat org makes them behave like a person with multiple personality disorder.) If your product doesn’t sell well in its first day, it will likely vanish into the abyss forever.
Thanks! I’m glad you liked it.
Thanks also for sharing the challenges that you’ve encountered, it’s great to hear from another VR indie dev like this.
Re: point 1, yes, the active market is small. That’s why I think it’s important to (ideally) sell on as many platforms as possible. With PSVR and the Oculus Store being the 2 prime alternatives to Steam. Of course PSVR is… a lot trickier given the fact that you need a PS4 devkit etc. Oculus store is pretty slow in accepting new titles I think.
Re: point 2, I think the “profit” part is indeed a tricky one, although of course it depends entirely on your dev budget. For example, based on some rough calculations the top 100 owned titles, released in 2017, have made more than $50K in revenue (the top 10 is above 1 million and top 20 above 500k in revenue) Titles in positions 100-200 have made between $20K to $50K in revenue. That last group is really not a lot, and you can’t expect much from those dev budgets, but for a solo dev, it might be doable to at least break even when doing a small project and making it into the top 20%. But yeh, it’s tough.
Re: point 3, That’s a thought provoking statement. I would LOVE to read an article about this that goes into detail.
Now I’m curious about your games, feel free to link them here. And I’m also eager to know what your 5th idea is 😀
GL!
Would love to see your take on 2018 numbers 🙂